

Fees for Actively & Passively Managed
Client Funds
by IFB-Group
Wealth Management Fees
ACTIVELY AND PASSIVELY MANAGED MANDATES
A fee is only fair when the client can see what it buys. This page sets out what International Finance Bank LTD charges for managing client assets, how each fee is calculated, and the return an active mandate must deliver before it earns more than a low-cost index fund. No small print, no surprises at year end.
The Benchmark We Have to Beat
An index fund simply holds the market. It costs between 0.03% and 0.50% a year, and it delivers the market’s return minus that fee. Over the long run, broad US equities have returned roughly 10% a year in nominal terms, or around 7% after inflation; global equity indices have returned somewhat less. These are long-term averages across decades, not a forecast for any single year.
Most active managers fail to beat their index over time, a finding documented year after year in the SPIVA reports of S&P Dow Jones Indices. An active mandate therefore earns its fee only if it clears the index after all costs. That is the standard we set for ourselves, and it is why our performance fees are paid only on returns above a benchmark.
Typical Earnings of Index Funds
Index funds aim to replicate the performance of a specific market index, such as the S&P 500, FTSE 100, or MSCI World, by investing in the same securities as the index. Their performance closely mirrors the underlying benchmark, minus minimal fees. The typical returns for index funds depend on the market index they track and the timeframe:
Historical Annual Returns:
- S&P 500 Index: approximately 10% per year nominal, or about 7% after inflation, over the long term.
- Global Indexes (e.g., MSCI World): Around 6%-8% annually over a multi-decade period.
- Emerging Market Indexes: Tend to provide higher returns (8%-12% annually) due to increased risk and volatility.
Factors Affecting Returns:
- Market volatility, interest rates, and macroeconomic trends.
- Minimal fees (0.03%–0.50% annually), ensuring investors retain most of the index’s performance.
Index funds, while low-cost and reliable, typically deliver average market returns over a long investment horizon. Wealth management models based on active strategies must justify higher fees by achieving superior performance above these benchmarks.
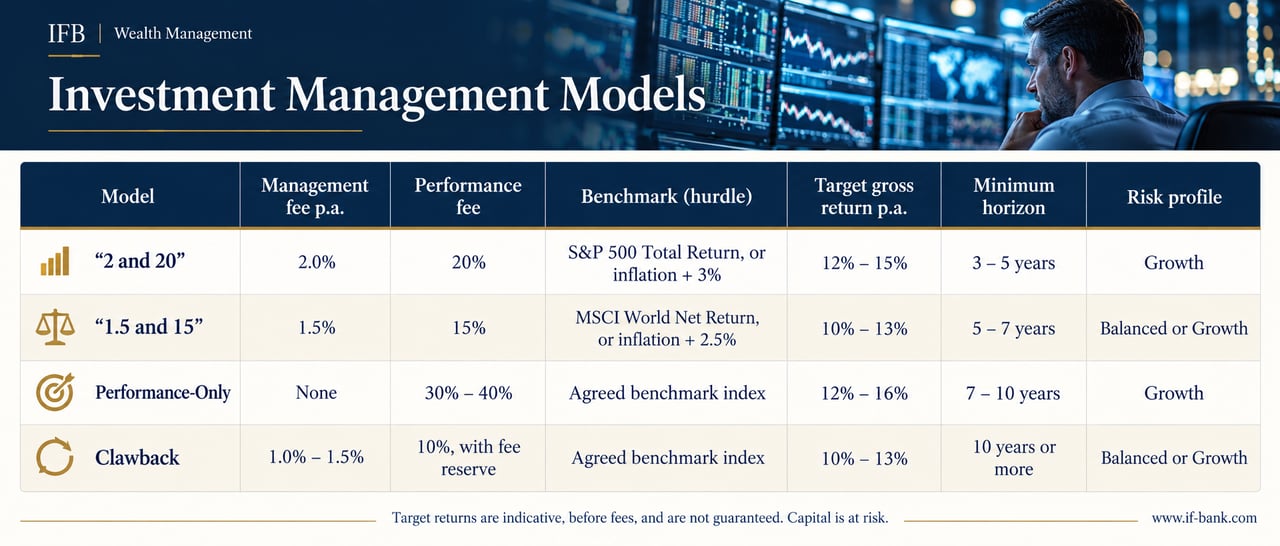
Target returns are what the strategy aims for, not a promise. Reaching double-digit returns requires a substantial share of equities, and with it the risk of interim losses. Each model is therefore offered only to clients whose assessed risk profile, horizon and capacity for loss support it.
Our Models

“2 and 20” Model
For clients with a medium- to long-term horizon who want the strategy to pursue clear outperformance of broad equity markets. The higher performance share rewards the manager only for returns above the benchmark, so client and manager pull in the same direction.
Structure:
- 2% Management Fee annually on AUM.
- 20% Performance Fee on profits exceeding a benchmark index return (e.g., S&P 500 or inflation + 3%).
Target Returns:
- 12%-15% annual gross returns, ensuring clients achieve 9%-11% net returns after fees.
Minimum Investment Horizon:
- 3-5 years. This timeframe allows for steady growth and periodic rebalancing while reducing the impact of short-term market fluctuations.
Example:
- A $1 million portfolio achieving a 15% gross return ($150,000):
- $20,000 management fee (2% of AUM).
- $28,000 performance fee (20% of profits above a 10% benchmark).
- Net client return: 10.2%.

“1,5 and 15” Model
For cost-conscious clients who accept a slightly lower return target in exchange for lower fixed and variable fees, measured against global rather than US equities.
Structure:
- 1.5% Management Fee annually on AUM.
- 15% Performance Fee on profits exceeding a benchmark return (e.g., MSCI World or inflation + 2.5%).
Target Returns:
- 10%-13% annual gross returns, ensuring clients achieve 8%-10% net returns after fees.
Minimum Investment Horizon:
- 5-7 years. This allows sufficient time for the active strategy to outperform market benchmarks and recover from short-term volatility.
Example:
- A $500,000 portfolio achieving a 12% gross return ($60,000):
- $7,500 management fee (1.5% of AUM).
- $4,500 performance fee (15% of profits above an 8% benchmark).
- Net client return: 9.6%.

Performance-Only Model
No fixed fee at all. The Bank is paid only when the portfolio beats its benchmark, and then with a larger share of the excess. Because the share is high, this model rewards patience and suits clients with a long horizon and a high tolerance for interim fluctuation.
Structure:
- No management fee.
- A 30%-40% Performance Fee on profits exceeding a benchmark index return.
Target Returns:
- 12%-16% annual gross returns, ensuring clients achieve 8%-10% net returns after fees.
Minimum Investment Horizon:
- 7-10 years. This longer horizon is necessary to balance the high performance fees and provide sufficient time for the active strategy to demonstrate consistent outperformance.
Example:
- A $300,000 portfolio achieving a 14% gross return ($42,000):
- $12,600 performance fee (30% of profits above a 10% benchmark).
- Net client return: 10%.

Clawback Fee Model
A moderate management fee, combined with a performance fee that is first credited to a fee reserve. Losses in later years are deducted from the reserve before anything is paid out, so the client never pays for gains that are later given back. The return target still requires a Balanced or Growth profile; the clawback protects against paying fees on temporary gains, not against market losses.
Structure:
- 1%-1.5% Management Fee with performance fees adjusted or refunded for losses in subsequent periods.
Target Returns:
- 10%-13% annual gross returns, ensuring clients achieve 8%-10% net returns after fees.
Minimum Investment Horizon:
- 10+ years. Long-term engagement allows the wealth manager to balance periods of gains and losses while implementing clawback adjustments effectively.
Example:
- A $400,000 portfolio achieving a 12% gross return ($48,000):
- $6,000 management fee (1.5% of AUM).
- $4,800 performance fee (10% of realised profits).
- If losses occur in the following year, fees are adjusted proportionally.
- Net client return: approx. 9% after fees.
How the Performance Fee Is Calculated
- Hurdle. The performance fee applies only to the part of the return that exceeds the agreed benchmark. A portfolio that merely matches its benchmark pays no performance fee.
- High-water mark. A performance fee is charged only on value above the highest level on which a performance fee was previously paid. After a losing year, the portfolio must first recover its losses before any new performance fee arises.
- Net of management fee. The performance is measured after the management fee has been deducted, so the client never pays a performance fee on money that went to fixed fees.
- Crystallisation. The performance fee is calculated and charged once a year, on 31 December, on the result of the full year. Quarterly crystallisation only by written agreement.
- Benchmark. The benchmark is fixed in the mandate agreement before the first investment and cannot be changed retrospectively.
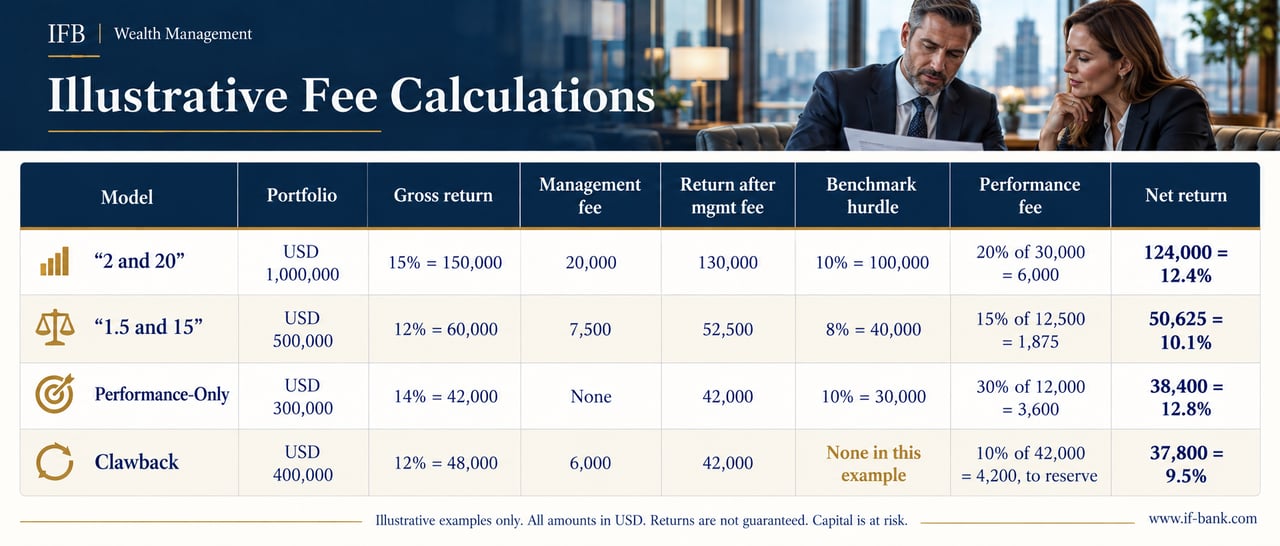
All examples assume the portfolio starts at its high-water mark and that no performance fee was paid before. Had the “2 and 20” portfolio returned 12% instead of 15%, the return after the management fee would equal the benchmark exactly, and no performance fee would be due: the client keeps 10.0%.
Results 2023 till 2025
The following figures show the results of the four models in client portfolios managed by the Bank. They are net of all fees / gross before fees, in USD, and cover number portfolios with combined assets of USD amount as at date. They have been prepared by the Bank and not independently verified.
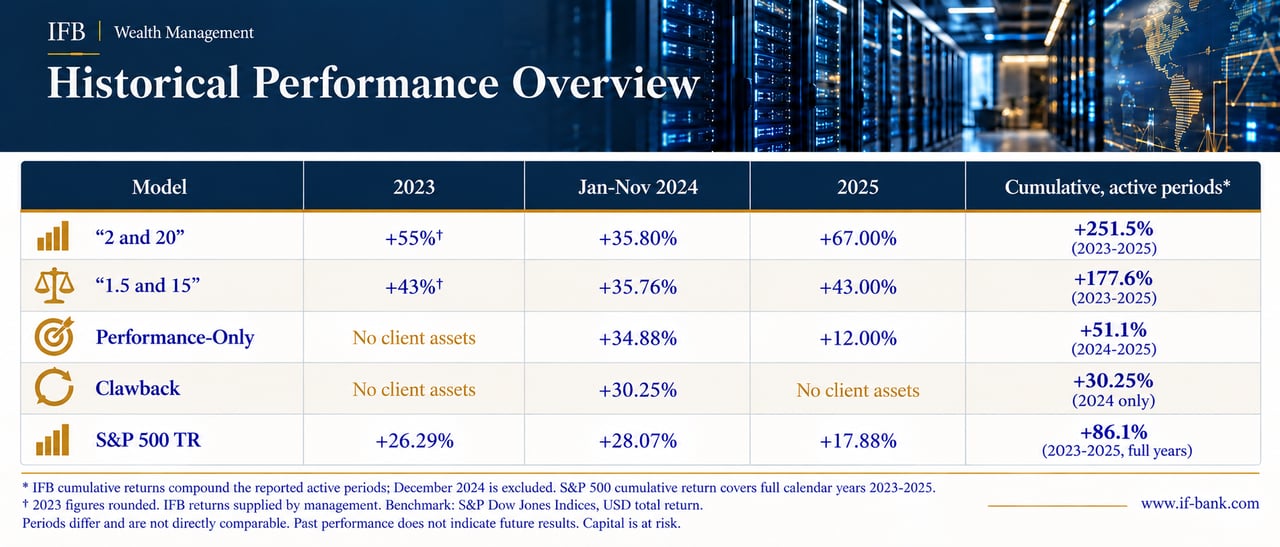
These were exceptional years, well above the long-term targets of the models, and they should be read as such. A strategy that gains 35% in a year can also lose substantially in another. Past results are no guide to future returns.
Disclaimer:
Past performance is not indicative of future results. Any financial performance figures, projections, or illustrations provided are for informational purposes only and should not be construed as guarantees or assurances of future returns. Investments are inherently subject to market risk, including potential loss of principal, and other factors beyond our control. You should carefully consider your financial objectives, risk tolerance, and consult with a qualified financial advisor before making any investment decisions.

Fees for Passively Managed Client Funds
Passively Managed Mandates
For clients who want broad market exposure at low cost, the Bank manages portfolios of index funds and exchange-traded funds in line with the agreed risk profile, from conservative to equity-focused. There is no performance fee.
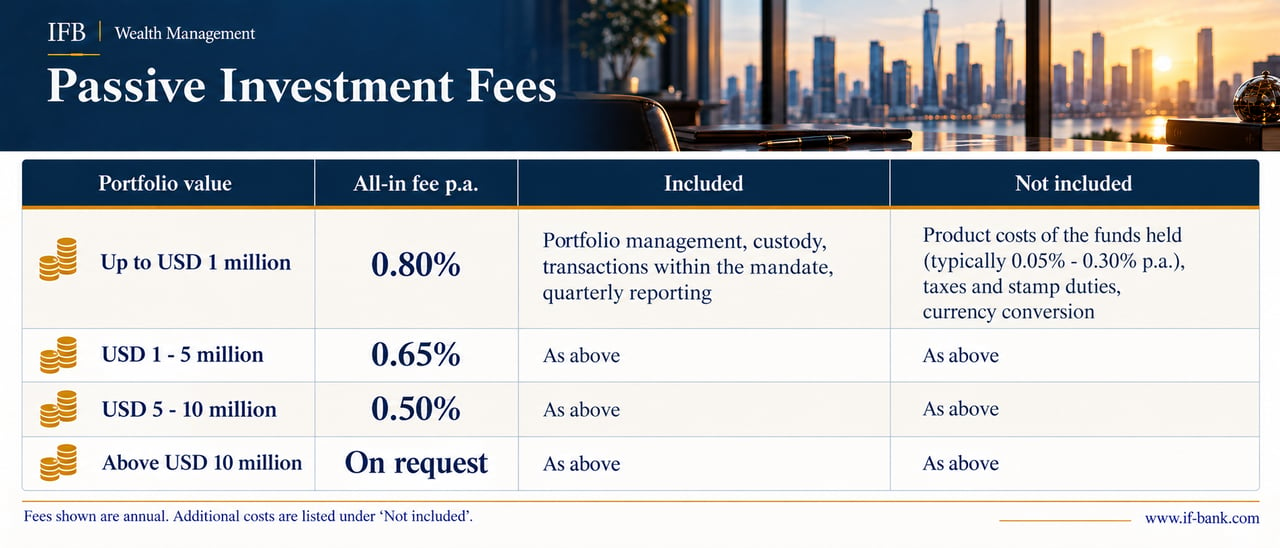
Minimum investment € 100,000; minimum fee € 2,500 a year. The fee is calculated on the average portfolio value and charged quarterly.
Other Charges
For accounts held on an advisory or execution-only basis, outside a mandate, the following charges apply.
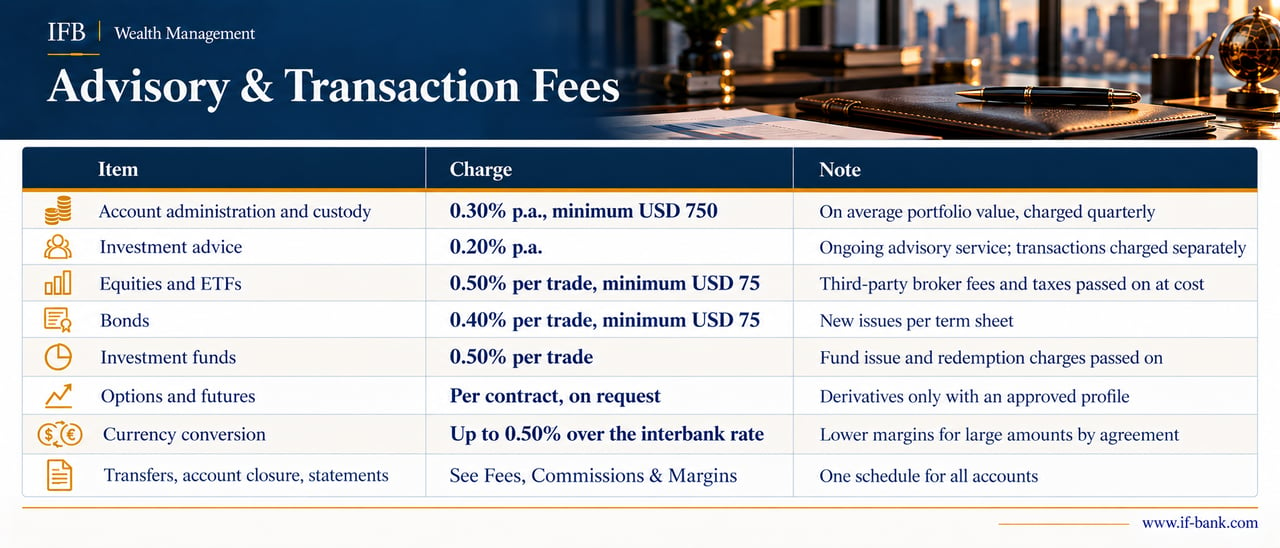
Minimum Investment and Fee Reductions
Active mandates start at USD 250,000. Passive mandates start at USD 100,000. For portfolios above USD 5 million, fees are agreed individually. Where several services are combined, account administration and transfer charges can be included in a single all-in fee.
Taxes and Reporting
Clients remain responsible for the tax treatment of their investments in their country of residence. The Bank reports under FATCA and the OECD Common Reporting Standard where these apply. Tax statements tailored to a specific jurisdiction are available for an additional fee.
Important Information
Target returns are objectives, not guarantees. The value of investments and the income from them can fall as well as rise, and clients may get back less than they invested. Past results are no guide to future returns. Fees reduce returns, and the effect of fees accumulates over time. Each mandate is offered only after the Bank has assessed the client’s objectives, horizon, financial situation, capacity for loss and knowledge of the products concerned. This page is for information only and does not constitute an offer.
Fees for Other Wealth Management Services
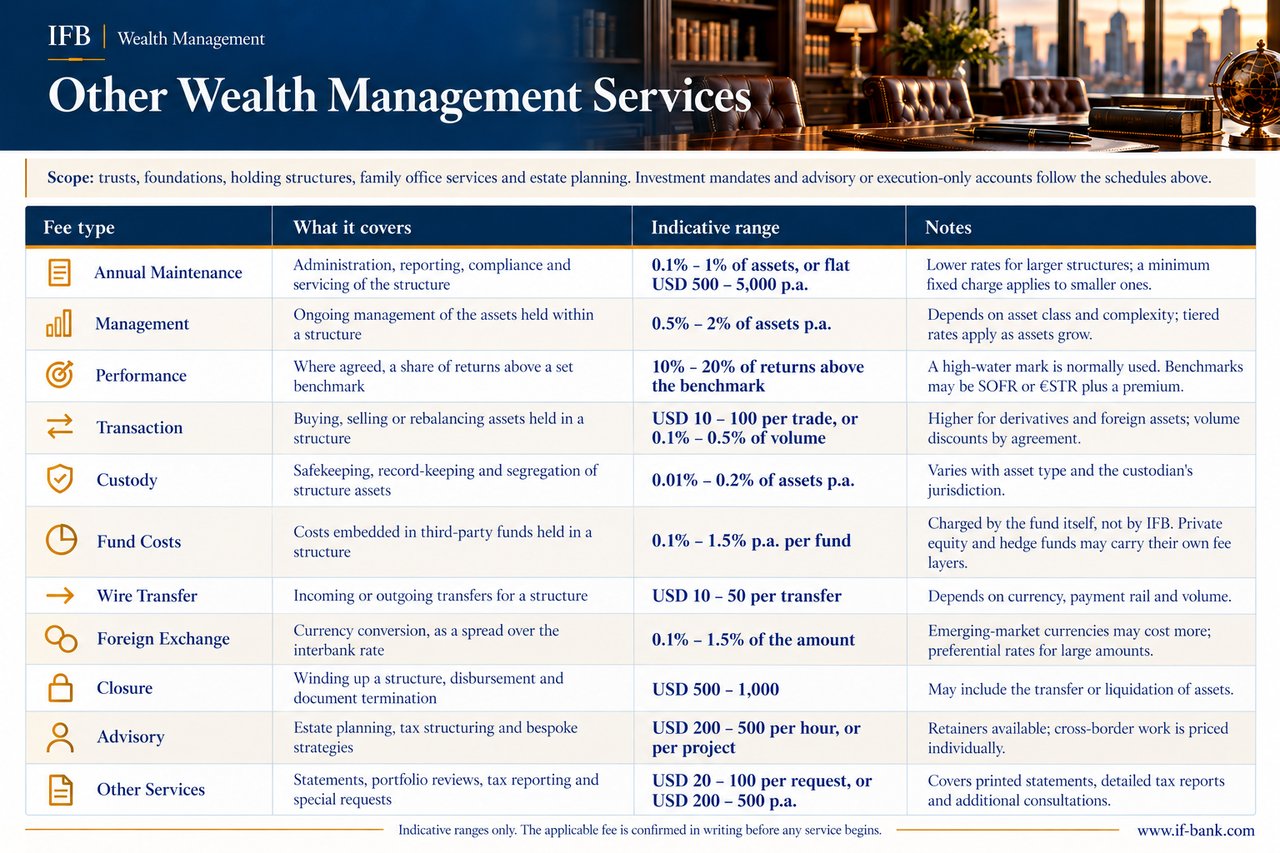
The fees above apply to investment mandates and to advisory and execution-only accounts. The following applies to the Bank's other wealth management services, such as trusts, foundations, holding structures, family office services and estate planning. Where a client uses both, investment-related charges follow the schedules above.
Additional Considerations:
- Minimum Account Size: Minimum asset thresholds depend on the service and structure concerned and are agreed when the relationship is established. Minimums for investment mandates are set out above.
- Fee Negotiability: High-net-worth clients or those with substantial investment potential may negotiate reductions in management, custodial, and performance fees. IFB accommodates such discussions based on the client’s overall portfolio value and relationship potential.
- Bundled Services: IFB offers tiered packages where select fees, such as account maintenance and wire transfer charges, are incorporated into a comprehensive management fee. These packages are designed to be cost-effective for clients seeking an integrated suite of services.
- Jurisdictional Variations: Fees may differ depending on the jurisdiction of the client, the structure used and the service providers involved. Operational costs and regulatory requirements, such as enhanced KYC/AML obligations, may result in higher setup or maintenance fees for certain jurisdictions.
- Enhanced Reporting Services: Clients requiring advanced reporting options, such as tax-optimised statements, in-depth performance analyses, or bespoke portfolio summaries, may incur additional charges. These services are particularly beneficial for clients with complex portfolios or specific compliance needs.
- Performance Fee Structures: For investment mandates, performance fees follow the calculation rules set out above. Where other wealth management services include a performance-related component, its basis and crystallisation period are agreed in writing in advance.
- Alternative Investments: Investments in private equity, real estate, or commodities through IFB are subject to unique fee structures. For instance, private equity investments may entail elevated custodian fees due to administrative complexity, alongside layered management and performance fees imposed by the funds themselves.
- Tax Implications: Offshore accounts with IFB may involve specific tax considerations influenced by the client’s country of residence. IFB provides specialised tax reporting services, available for an additional fee, to help clients comply with international tax requirements.
- Ranges: The ranges shown in the table below are typical indications for these services. The fee applicable to a client is confirmed in writing before any service begins.
Do you still have questions?
Please book a Zoom Videoconference here: